

Share your Data, Navigate Safer
Official charts can be out of date in changing harbors and shallow areas such as rivers and creeks. User reports help improve ocean maps and make navigation safer.
The Vector Charts Crowdsourced Data program helps maritime product developers and end users contribute to improving chart data.
We provide a managed API for user data submission and display.

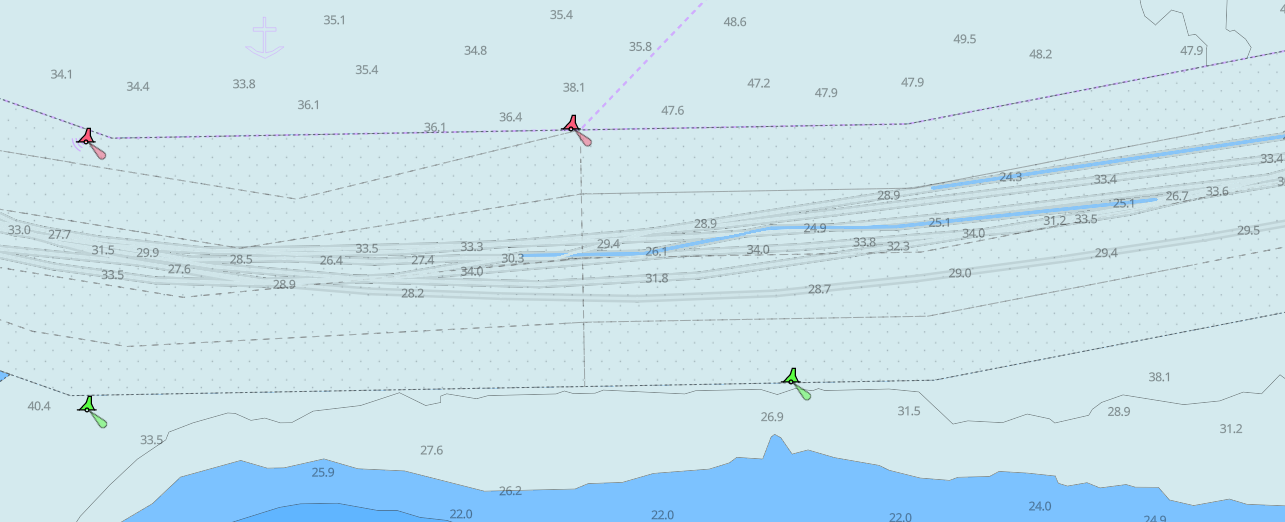
Report Depth Information
Using the Bathymetry Report API, users can report depth information from their sonar or other depth-sensing devices.
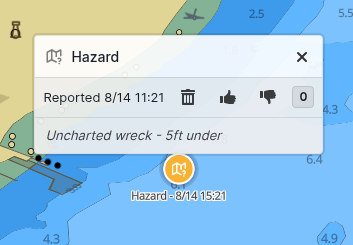
Report Hazards
Using the Hazard Report API, report point hazards such as debris, wrecks or marine wildlife.
Upvote or downvote reports to help improve the quality of the data.
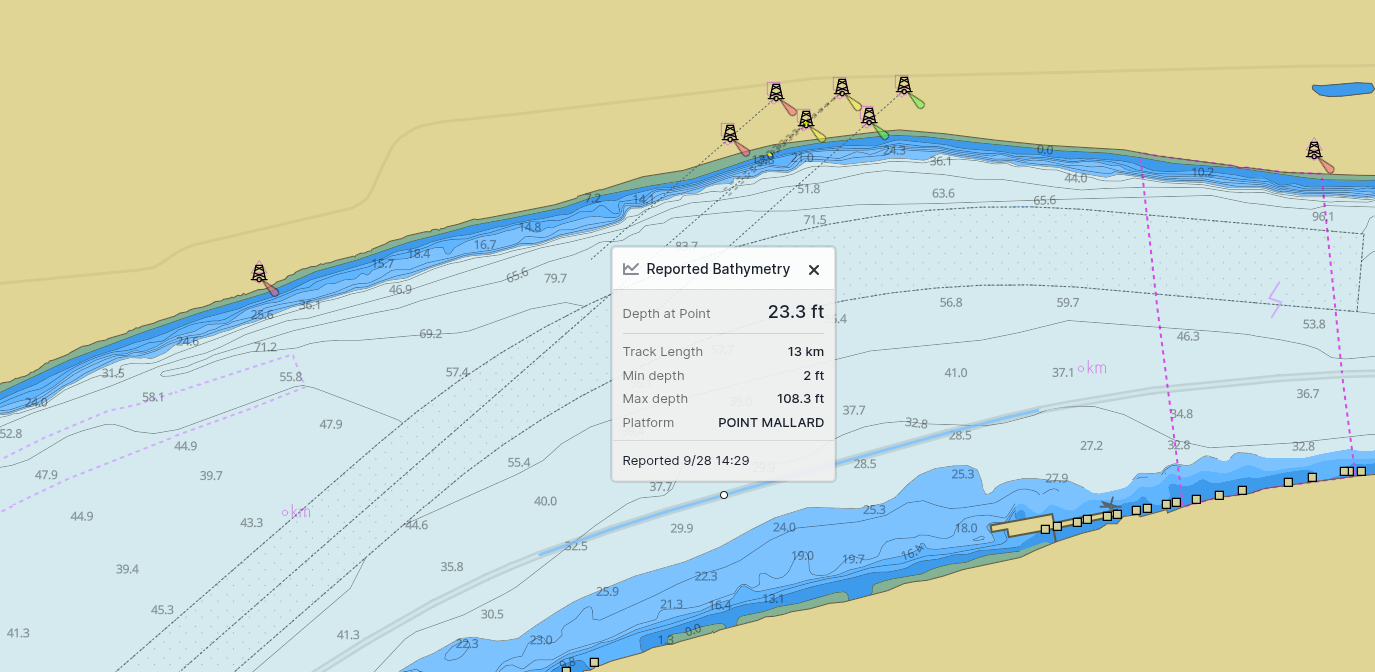
View & Interact with Reported Data
Crowdsourced reports are rendered on Vector Charts maps using dedicated styles which call attention to user safety reports separate from official ENC data.
Trusted Data made Easy
We operate the end-to-end ecosystem to receive, store, process & share user reports at scale.


Free to Contribute
The Vector Charts Crowdsourced Data program is free to use for any users on the Vector Charts platform. To get started, create an account and start submitting data today!




Vector Charts is built by Zydro Marine Technologies, Inc.